

| General Information | |
|---|---|
| Repository |     |
| Build |    |
| Code |      |
 |
 |
 |
 |
 |
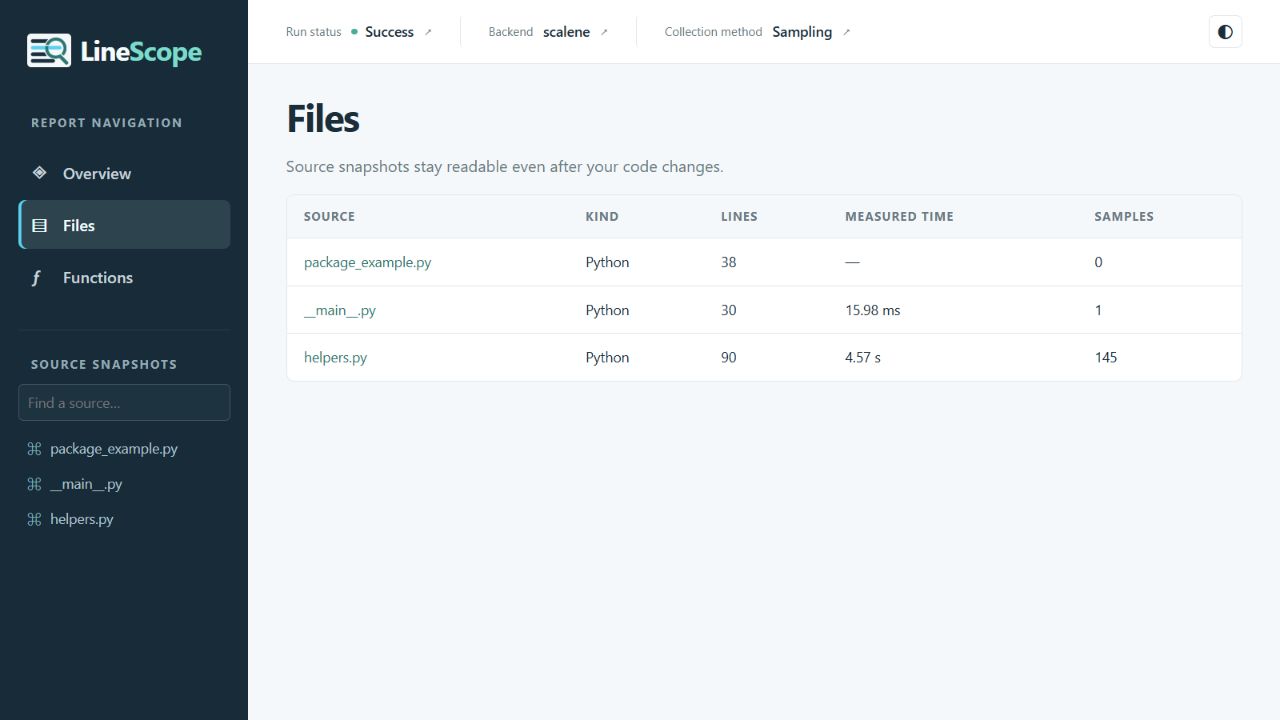 |
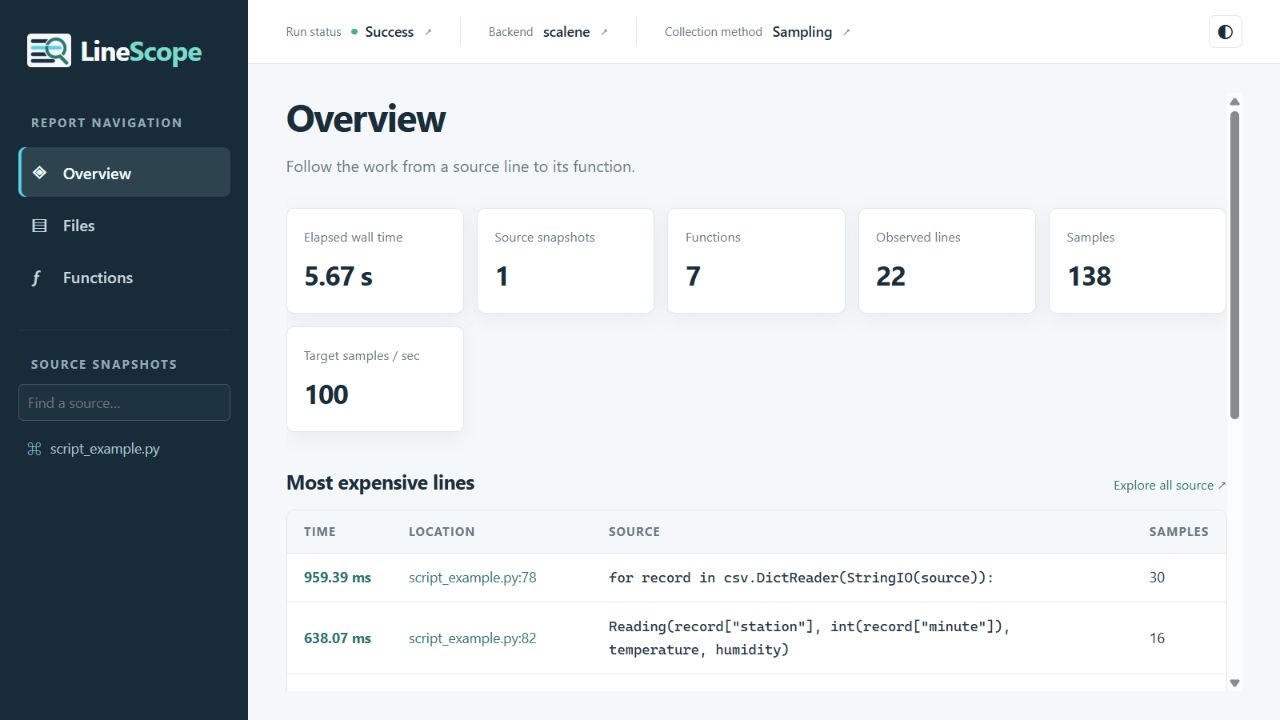
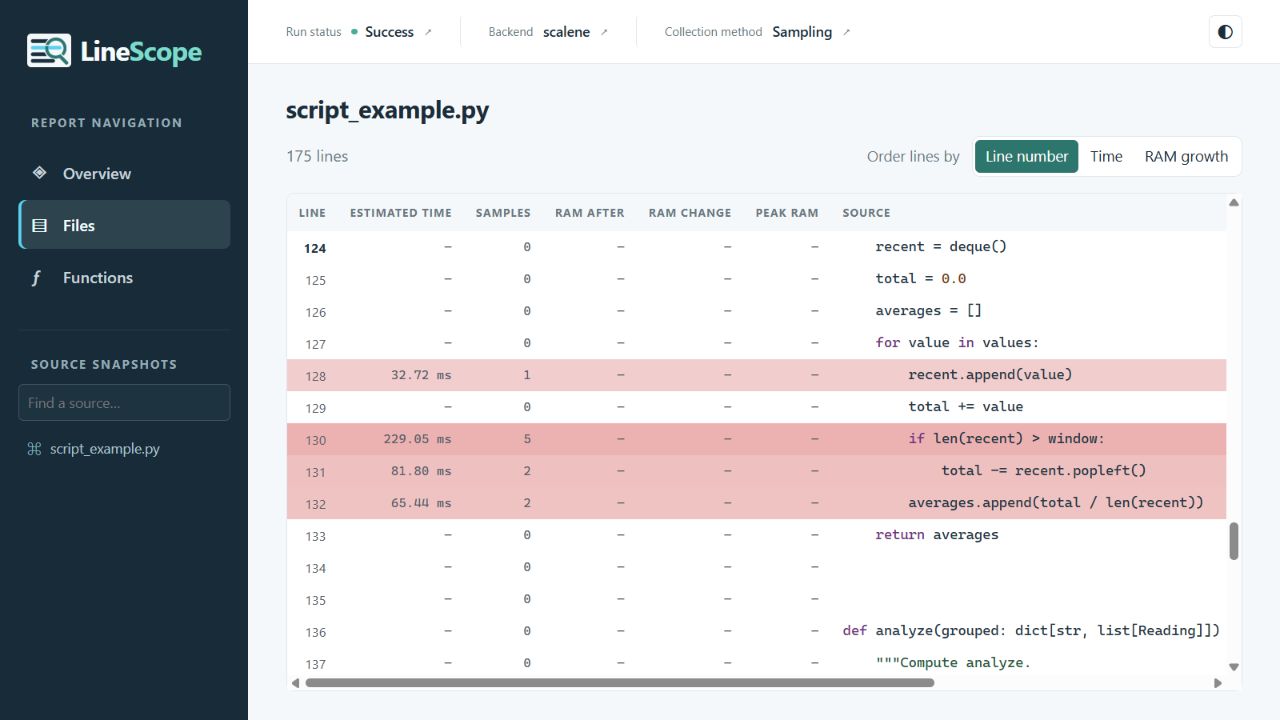
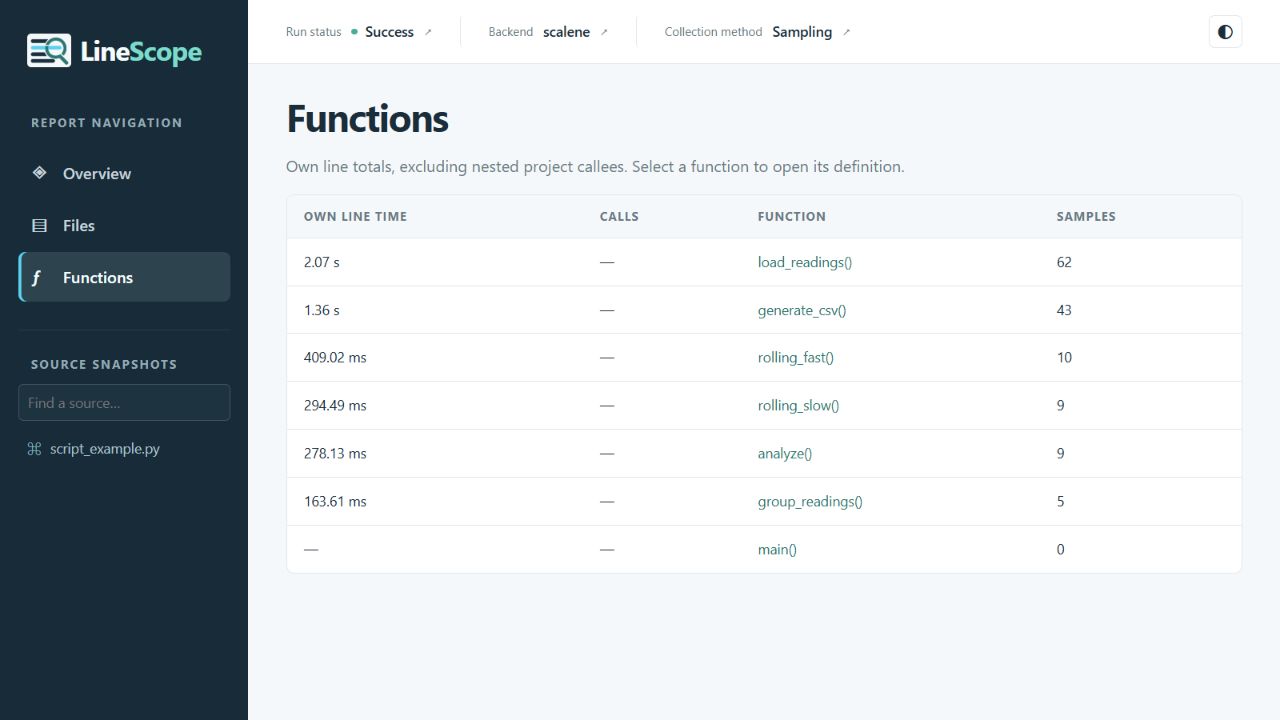
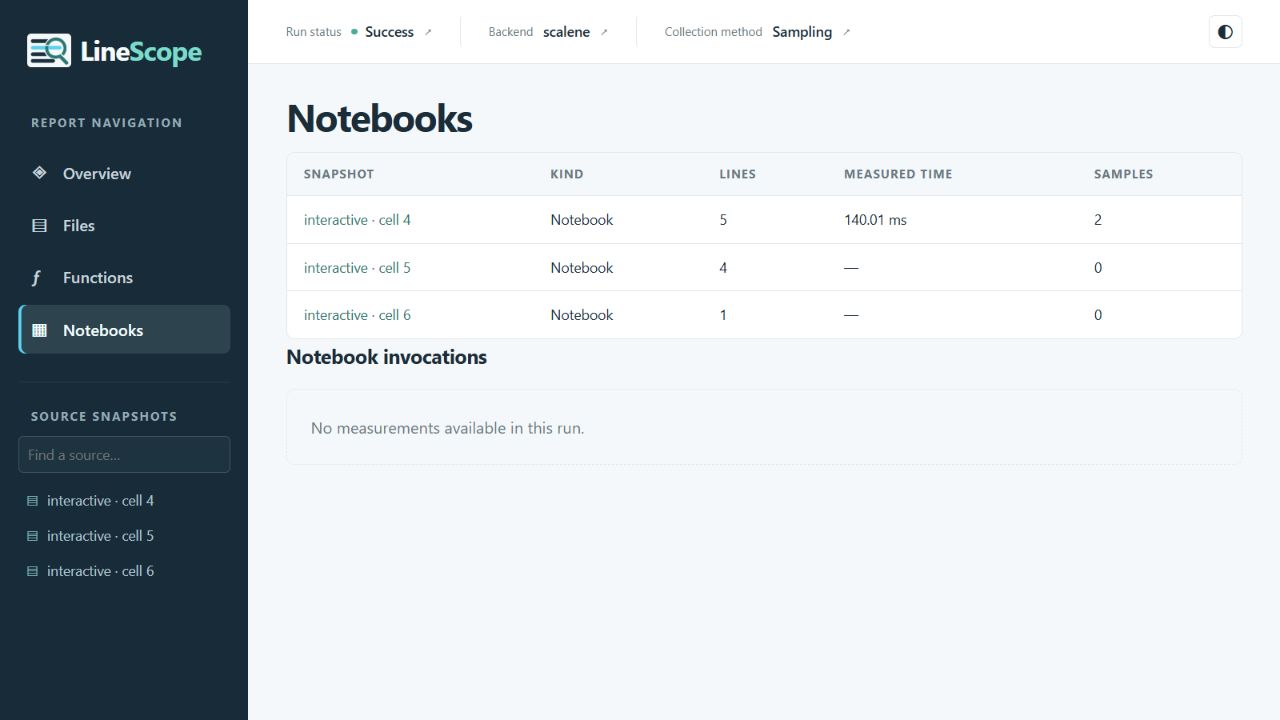
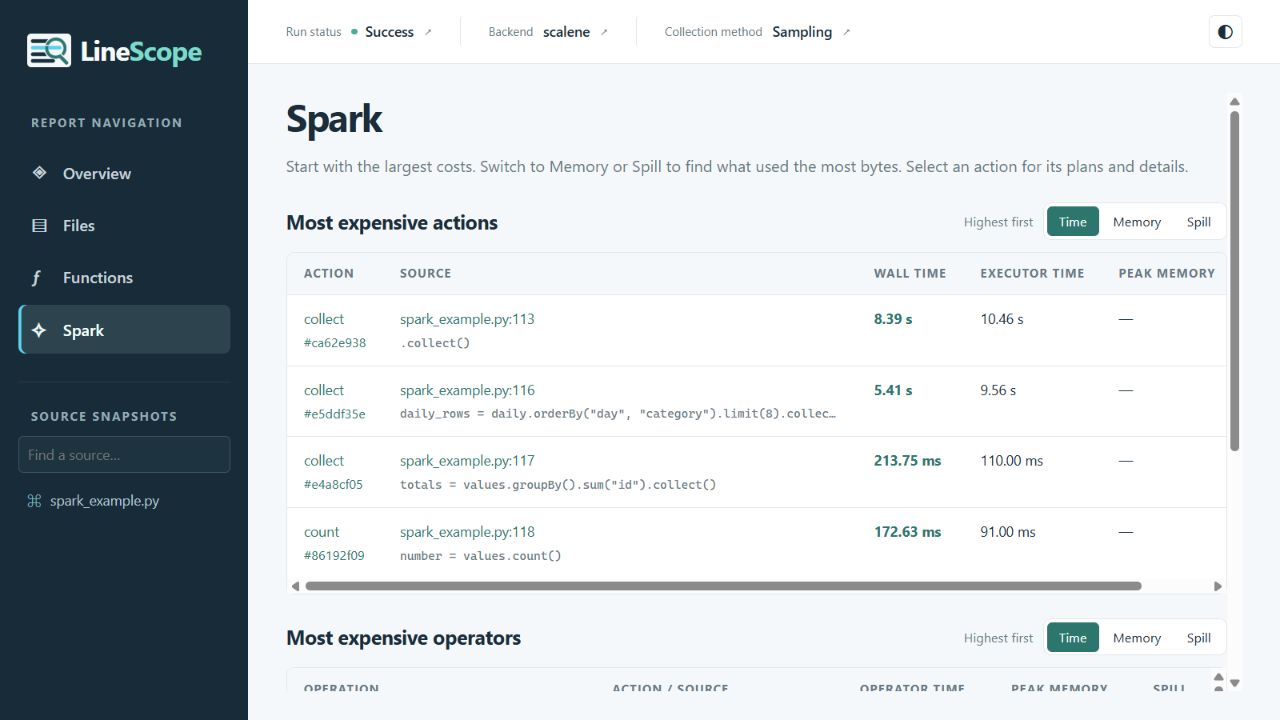
Profile Python source line by line, including notebook cells and Spark actions. Reports contain source snapshots, timings, memory measurements, and definition links in one HTML file. Library work is attributed to the calling project line.
Python 3.11–3.15 is supported. Install in your script or notebook's environment:
uv pip install -U linescope| Extra | Adds |
|---|---|
linescope[notebook] |
IPython cell magics and inline reports |
linescope[scalene] |
CPU sampling and GPU metrics on Python 3.11–3.14 |
linescope[full] |
Both extras |
For unreleased changes:
uv pip install -U git+https://github.com/tvdboom/linescope.git@mainSpark and Databricks use the runtime's PySpark and SDK. Enable Spark observation
with spark=True or --spark.
linescope --memory --output report.html your_script.py
linescope --output report.html -m your_package.your_module
The report opens in a browser. Add --display none to save without opening it.
Put profiler options before the target; subsequent arguments go to your program.
from linescope import profile

with profile(memory=True, display="none") as session:
    total = sum(value * value for value in range(100_000))

session.save("report.html")
Trace is the default. Select backend="scalene" for sampling or GPU collection,
or backend="tachyon" for sampling on Python 3.15.
%load_ext linescope%%profile --display cell-summary
total = sum(value * value for value in range(100_000))| Relevant links | |
|---|---|
| ⭐ About | See what LineScope measures and how reports present it. |
| 🚀 Getting started | Install LineScope and generate your first report. |
| 👨💻 User guide | Choose a backend, configure profiling, and read reports. |
| 📓 Notebooks and Databricks | Profile individual cells or a whole notebook session. |
| ⚡ Spark | Trace Spark actions back to source lines and interpret plan metrics. |
| ✨ AI suggestions | Request performance suggestions for profiled code from a report. |
| 🎛️ API reference | Look up Python APIs, configuration, and result models. |
| 💻 CLI reference | Look up command-line options for profiling scripts and modules. |
| ❔ FAQ | Find answers to common profiling questions. |
| 🔧 Contributing | Set up a development environment and run the project checks. |
| 🌳 Dependencies | Review required packages and optional integrations. |
| 📃 License | Read the MIT license terms. |